|

NetKernel News Volume 2 Issue 29
May 20th 2011
What's new this week?
- Repository Updates
- *New* nk4um v1.0.0 / Liquibase on NetKernel
- Resource Oriented Optimisation
- NetKernel's Continuous Scale Invariant Profiling
- Endpoint Profiler
- Visualizer Techniques: All the details and then some
- Zen and the Art of ROC
- Sun Bathing Good for You
Catch up on last week's news here
Repository Updates
The following updates are available in the NKEE and NKSE repository...
- demo-redirect 1.3.1
- Fixed a potential transreption bug in the fourth demo (thanks to Paul Hermans for reporting this)
*New* nk4um v1.0.0 / Liquibase on NetKernel
Chris Cormack has released the nk4um application and has published it in the new netkernelroc.org Apposite repository. He's provided all the details of how to add this as an additional repository here.
One of the things which marks nk4um out as a superior application is its ability to manage and maintain the RDBMS. Its been incredibly painless to progressively refactor the RDBMS as new features and optimisations have been introduced. The way this is achieved is by using the Liquibase database refactoring tool.
I first heard about Liquibase about 2 years ago in a talk by Tim Berglund (who I'm glad to say found time to come to the NK conference). Since then we've used it for all our development and production databases. Its hard to explain how it introduces a new level of QA in the correlation between application development and database integrity. But I highly highly recommend reading up on it.
I think I introduced Chris to it some time ago but he's taken its use to a new level in nk4um - making it an integral part of the back end adminstration tools. So, for example, using Liquibase to install and do the RDBMS set up at install.
He's integrated Liquibase as a set of simple accessors in an NetKernel module. Since nk4um uses this then it follows that it is also available on the NetKernelROC repo as the package netkernelroc-liquibase.
Combining Liquibase with NK is cool. Go get it.
Resource Oriented Optimisation
Last week we announced the launch of the migrated http://www.1060.org/nk4um/ application. Over the following couple of days Chris Cormack and I spent some time tweaking various aspects of the implementation to optimize the realworld performance.
Chris kept notes as he introduced changes and he's written a very nice article which explains the optimisation steps that were introduced...
It gives a very good sense of the areas of focus that can be examined and enhanced to tune up an application. It certainly exemplifies how with ROC it is ok to defer optimisation and first and foremost concentrate on making the application do what it is supposed to. Optimisation is cheap and relatively simple to introduce in a post-hoc development phase - Chris's numbers show that within a couple of days we'd got several orders of magnitude optimisation; from what was in no way "a slow app", to one that is "near instant".
While Chris gives plenty of concrete examples of areas he optimised, I thought I'd discuss some of the techniques and maybe highlight how/why the ROC concepts enable optimisation to be an orthogonal part of your development process.
NetKernel's Continuous Scale Invariant Profiling
The nature of the ROC abstraction in NetKernel is that every request for every resource is mediated by the kernel. We are therefore able to determine the real computational cost of every resource. This is primarily used as part of the relative cacheability score and allows us to answer questions like "if I were to throw away A or B which stuff would cost most to recompute?" - which are questions you need to nail if you're going to dynamically track the energy minima of the comptutational state space.
But before you yawn and say, Pete's off on another thermodynamic rant again, wake-up because it has some really cool additional beneficial consequences...
In short, measuring everything that's going on, as a first order operation of the kernel, means that NetKernel is profiling every endpoint in the system, all the time, for free - ie without the "Heisenberg Effects" you get with attached low-level JVM profiling and/or when you implement your own internal fine-grain timing. (Think about that for a second).
Furthermore, because this is ROC, the profile resources we accumulate are scale-invariant, which means you can look at the macroscopic performance of a complete channel, or the microscopic performance of one operation, or at any zoom factor in-between.
Endpoint Profiler
The Endpoint Profiler is a tool that provides a broad macroscopic view of the performance of every endpoint in your system. It's actually a statistical profiler which shows the total hits, average and accumulated total execution time for every endpoint. It's provided with NKEE here...
http://localhost:1060/tools/ee/endpoints
Example Usage
So lets take a look at some live statistics for our nk4um server (http://www.netkernel.org/nk4um/) after it had been up in steady daily operation for a couple of days. Lets use it to think about about the general qualitative performance of the the application under real production load.
So Chris documents in his article how he found several optimisations in his SQL queries. Lets see how well he's really doing by looking at the RDBMS query accessors...
PATH				CLASS				HITS	ERRORS	AVG  	TOTAL
------------------------------------------------------------------------------------------------
org.netkernel.rdbms.endpoint	SQLPSQueryAccessor		5922	0	5.57	32980.86
org.netkernel.rdbms.endpoint	SQLPSBooleanQueryAccessor	1962	0	29.88	58619.45
Hey what do you know - the first line is telling us his average SQL query is taking about 5.5ms. That's pretty good - doesn't mean there aren't some pathological outliers still there, but generally we can relax the effort focused on the DB layer.
Well perhaps not, look at the second line, his SQLPSBooleanQueryAccessor has an average response of about 30ms - that seems a bit high to get a true/false resource. Might be worth taking a look at the all the places where active:SQLPSBooleanQuery is being requested and see if the queries can be tweaked.
OK, next lets look at his application specific endpoints. Chris likes to use regular Java classes but he uses Java as a dynamic language by using the active:java runtime. Here's its profile...
org.netkernel.layer1.endpoint JavaRuntimeAccessor 35106 6 .66 23291.07
Pretty nifty, its getting a lot of hits but its average execution time is sub-millisecond. No major worries about the general quality of the code in this application. (Robin give him a raise - this guy's good ;-).
The profiler knows that the JavaRuntimeAccessor is a "language runtime" so it also breaks out the individual profile for each specific class its executing (same would hold if this was the groovy runtime, XSLT etc etc). So lets look through these items in detail, are there any hotspots? Hmmm whats this...
org.netkernelroc.nk4um.admin.forums.list.ListAccessor 1 0 29.05 29.05
Ouch 29.05 milliseconds - that's a pretty nasty one. No idea what its doing but its expensive. But then, look, its only been hit once in the whole time the apps been up. OK its irrelevant - its either not an important part of the application or its execution cost has been amortized by the result being cached - either way its not worth worrying about in a first pass.
What else...
org.netkernelroc.nk4um.db.topic.TopicAccessor 2265 0 0.09 206.62
Hey that's more like it. This is the primary endpoint to handle the viewing of a topic. Its running in 90 micro-seconds average. That's micro not milli seconds - seems pretty acceptable! Anything else while we're here - hmmm it seems like most stuff is running sub-millisecond (which is what the JavaRuntimeAccessor told us at the top) but what's this...
org.netkernelroc.nk4um.db.post.ListAllVisibleTopicAccessor 842 0 8.22 6921.44
Hmmm this looks like a candidate for optimisation. Its taking 8 milli-seconds , which on face value is not that bad, but its being hit regularly (842 times). So out of all the JavaRuntime executions it has taken 6.9s of the overall 23s - this thing is 30% of the entire application cost! Would be worth taking a look at this. Maybe its legitimate, but still its good to know where to put our effort to get a return on the optimisation effort.
And so its goes - this is just a typical way that you can give yourself a sense of the shape of the computational energy surface...
So its true I'm really not bullshitting about the computational energy cost of the state of the system being an N-dimensional surface - this tool is giving you point-cuts through the surface!
For me, the cool part of this is that this information is cost free - I can look at this anytime I like whether during development or after months and years of constant production use. I can always have a sense of how my solution is performing.
Visualizer Techniques: All the details and then some
We saw above how the endpoint profiler gives us a statistical view of all our endpoints - which allows us to gain a general overview of the profile of our system. But in ROC looking at one endpoint is kind of dumb. Solutions are composite assemblies of several tools - we need to be able to look at the assembly - or actually we want to be able to look at sets of resources. Which is where the visualizer comes in.
The visualizer can be used as time-machine-debugger, but it also provides complete disclosure of the performance of every request in every tier of your solution. By default, when it's active it captures all requests, but you can be more selective by setting a regex filter to only capture very specific subsets of the resource requests.
So lets get concrete. Lets take a look at the nk4um application in the visualizer. In particular lets look at the "forum/x/ channel" and in particular one resource instance, the view of all topics in the "Solution Developer" forum - which just happens to be the most used forum with the most topics (so its the most valuable resource set, by usage):
http://www.netkernel.org/nk4um/forum/8/
(Go take a look - at time of writing there was a new topic added just last night)
When you try this page, we see that there is boilerplate HTML framework - but all the action seems to be going on with the AJAX table.
OK I switch on the visualizer and look at the page. I see my primary request for http://www.netkernel.org/nk4um/forum/8/ - not very interesting this is a pseudo-static resource, but below it I find this...
http://www.netkernel.org/nk4um/forum/8/getRows.ajax
Ah, more interesting, so this is the resource that is being requested by the ajax table. Lets dig down into this.
OK so lets take a look in depth with the visualizer. I captured a request to this channel - actually I'm going to show you the second request, since usually the first request to a service will show too much detail of all the transreption etc etc that goes on in "JIT compiling" the representations etc. Usually the second request shows us the steady state performance of a channel.
Here's the top of the request stack of the second request to the ajax service...
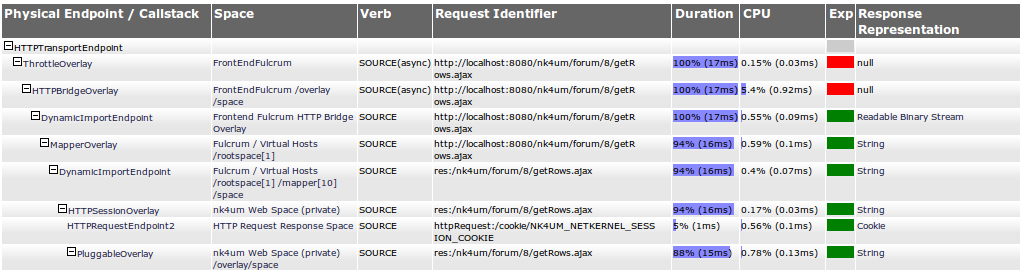
So the first thing to notice is that we're going through several layers of HTTP-plumbing. Remember I didn't write this application, in fact I've got very little specific knowledge of what it's doing - this is all Chris' architecture. But I can immediately see its going through a layered HTTP stack on the front-end all the way down to the HTTP Session overlay - ah, so he's using stateful sessions for all users even when they're not logged in - ok that's a useful heads up on the general design.
What else, ah, right at the top row - he's using the throttle overlay. Nice he's put in place an engineering constraint to ensure this service can never get overloaded and will always gracefully handle load in a way that will be impedance matched to the physical capabilities of the host. Good job - quality engineering.
Next thing I notice - again looking at the first row - the Duration column is telling me that the complete time for the channel is 17ms - I know this because the duration is the total time that an endpoint takes to satisfy its request and, since this is the top of the stack, this must be the time to satisfy the transport request - which is the web request on the edge of the system.
But notice that actually the throttle didn't actually spend very much time doing anything - the time spent using the CPU in the throttle was 0.03ms - it very quickly issued another request to the next tier. So we see that the Duration tells us the the time to fulfil a request (including sub-requests below this point), the CPU column tells how much time was spent inside this specific endpoint (ie not including sub-requests) - this is the cost of the endpoint's operation, not the cost of sub-requested endpoints.
What else can we learn. Well we can see that the top row shows 100% in 17ms. And we see that by the time that we get to the Session overlay we're at 88% in 15ms. This is telling us the HTTP-Plumbing is (100-88) = 12% of the entire channel cost, and that its taking 17-15ms = 2ms. Looking up the CPU column we see that the HTTPBridge is using 0.92ms of CPU time - huh this is to be expected, as a protocol, HTTP is a mess and you'll "burn a millisecond working with it". OK lets move on, here's the next layers...
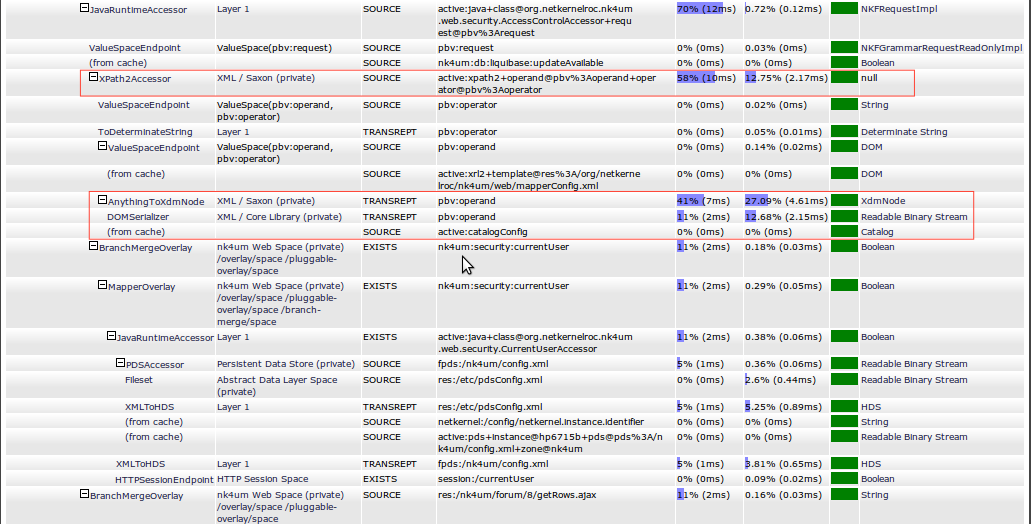
Ah - first line of this selection is showing us that there's a security AcessControlAccessor. Hmmmmm, I have no idea what its doing, but these two regions are interesting (shown outlined in red). There's an active:xpath2 that's taking 12.75% of all the CPU cost (2.17ms) and also, below it as a sub-request that seems to be TRANSREPT to XdmNode - WOW this is taking 27.09% of the total CPU cost, but furthermore its using automatic transreptor chaining and its also doing a TRANSREPT with the DOMSerializer - another 12.68% (2.15ms).
I dunno what this stuff is but its the "Cuckoo in the nest" of this channel. All told we're burning over 8ms of CPU here.
With my x-ray ROC vision the visualizer is also telling me some other stuff. When I click on the result of the XdmNode transreption I can see that this is actually a "pseudo-static" config - at first glance it looks like Chris is using dynamically generated mapper configuration which he's decorated with security metadata.
Ah yeah he's actually building the config with active:xrl2 (look at the line above the first red box)..
active:xrl2+template@res:/org/netkernelroc/nk4um/web/mapperConfig.xml
...which he's hitting the cache for. Good - so why is his TRANSREPTION running every time? Time to go look at his code.
I opened up org.netkernelroc.nk4um.web.security.AccessControlAccessor and the first request is this...
INKFRequest processIncludesReq= util.createSourceRequest(
    "active:xrl2",
    null,
    new Arg("template", "res:/org/netkernelroc/nk4um/web/mapperConfig.xml")
);
Oooh - he's invented his own syntactic sugar with a Util class to create requests - whatever turns you on ;-) But what's this - he's not issuing the request, he's relaying it as a pass-by-request argument...
String requiredRole= util.issueSourceRequest("active:xpath2",
    String.class,
    new ArgByRequest("operand", processIncludesReq),
    new ArgByValue("operator", "xs:string(//endpoint[id='" + name +"']/role)")
);
Hmm - I think he's got the right intent - he sees that the XRL2 built config is steady state. But why not just give it a mapper entry (identity). Passing requests around is being too fancy - its causing the transreption to occur in a non-local scope - which means the result is cached, but every time it's requested we'll have a different request scope - so we'll never hit the cache - so the result is we pay the TRANSREPTION cost every time - which we know is expensive.
Hmmm quick fix. What about if we use the resource's real name and just request it by by this (since we know its in the cache)?...
String requiredRole= util.issueSourceRequest("active:xpath2",
    String.class,
    new Arg("operand", "active:xrl2+template@res:/org/netkernelroc/nk4um/web/mapperConfig.xml"),
    new ArgByValue("operator", "xs:string(//endpoint[id='" + name +"']/role)")
);
Bingo - less than one line change and look what happens, the second time I try (after TRANSREPT JIT is done)...
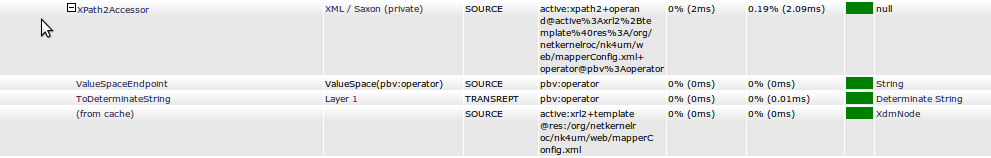
Wow - the TRANSREPTION has gone away, the active:xpath2 is now the only cost. Not bad. But what happens on the 3rd request...
Double Wow! Would you look at that (last line), the xpath2 doesn't need to run again - it hits the cache too. (I am the same person so the scope/identifier of the xpath2 is the same every time I view the site - no need to do it again!).
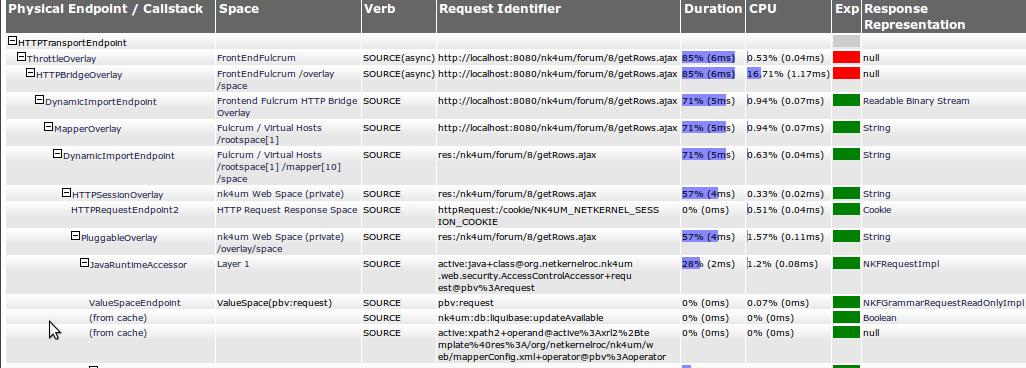
But look at the top line - the "total channel cost" - Triple Wow - I just went from 17ms to 6ms - changed one line of code and my channel performance goes up by 280%. Not bad.
But its even better than this - this is the security overlay - its used by every request - so I've gained a compound performance gain - the main template page and every ajax request (and whatever other requests Chris is making) all eliminate this 11ms - which adds up to the browser now giving a noticeably faster response for every page view! Result!
OK lets finish this up - we've still not actually got to the bottom of this channel... lets look at the requests that are actually doing the real resource generation...
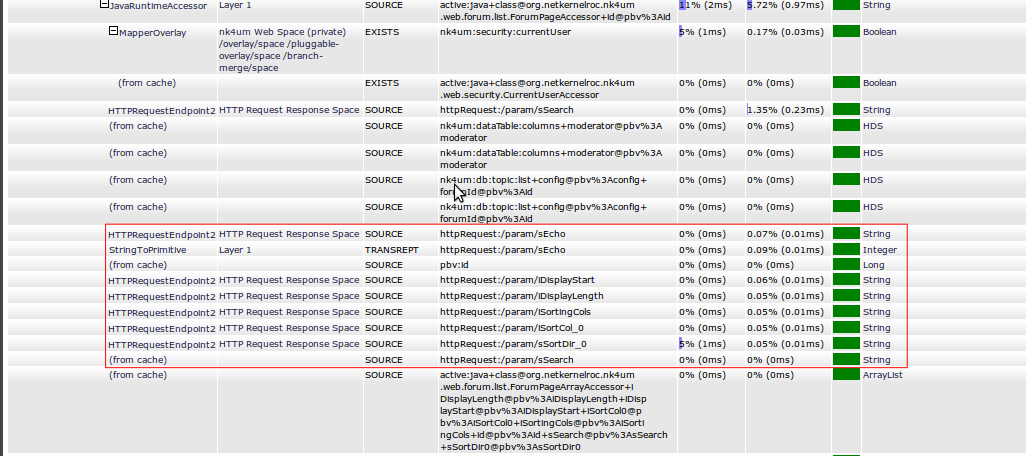
Hmmmm first thing to notice - the actual AJAX resource generation is done by ForumPageArrayAccessor - and its hitting the cache - so its the same for every request (as you'd expect). Seems to be called using a wrapper/normalisation layer which is doing the interaction with the table ajax parameters in the httpRequest:/param/x space.
Hmmm look at that, 9 requests go back to the httpRequest:/param/x - although requests are cheap, they still occupy the kernel and potentially lead to contention for threads etc. Given that this is one endpoint why not just ask for all the parameters in one request httpRequest:/params - one 0.01ms request to rule them all. Not a big thing but it would certainly remove a lot of unnecessary requests so generally "a good thing"
And so it goes...until the CPU never has to run at all ;-)
Summary
Why is this possible? Why can't you do this with regular classical software?
Because in ROC the relationship between all your code is completely dynamic and instantaneously bound. It really doesn't matter what order you compute things, so long as by the end you have the resource state you need. ROC allows you to progressively tease apart, reorder and normalize the process execution. Because things are decoupled, nothing breaks when you make small complimentary changes to the system (this is not a surprise, that's why I keep banging on about "the economic properties of the Web").
ROC optimisation is about finding the state that has a life outside of a single request and moving it into the spacial scope that makes it common for all users. That's all I did. In fact that is all that optimisation has ever been. Finding the smallest possible set of computational state - which requires that the computational relationships are normalized.
Even though I didn't know a thing about the internals of how this application is constructed, I was able to understand its structure and apply engineering effort in the right places to make it go faster. That's ROCit science.
Zen and the Art of ROC
Everything I have shown you here has involved simple steps - and simple thought processes to reason about the system. ROC lets you see the cogs and wheels and gears of your information architecture and its operational state.
Understanding and being able to work out how to optimize the request structure and spacial relations to fully exploit the cache is one of those things that comes with practice and experience. But it can also be taught - its just "engineering".
Indeed mature engineering disciplines embrace this. Its no surprise that the classic textbook in Electronics is Horrowitz and Hill "The Art of Electronics". Electronics like all engineering domains is a multivariate system. Such systems are non-analytic and non-deterministic - which is why its called "The Art of Electronics".
Software engineering is the same - but for too long its been the domain of the mathematician and the mathematically oriented computer scientist. Step away from your language, step-away from the "magic frameworks", step-away from the APIs. ROC is a breakthrough because for the first time it embodies a world that yields, normal-form information systems. Understand the information, understand the resource relationships, become an information engineer.
If you want to the learn the "Art of ROC" I can teach you. Take a training course. If you know ROC but want to become a master - take an advanced course. You can easily do this stuff too - its not Rocket Science!
Sun Bathing Good for You

|
You know how you were always told not to stare at the sun. Well now you can, whenever you like, in real time... As I tell my kids, we are truly living in astronomy's golden age. Enjoy it. |
Have a great weekend,
Comments
Please feel free to comment on the NetKernel Forum
Follow on Twitter:
@pjr1060 for day-to-day NK/ROC updates
@netkernel for announcements
@tab1060 for the hard-core stuff
To subscribe for news and alerts
Join the NetKernel Portal to get news, announcements and extra features.
NetKernel will ROC your world
 |