|

NetKernel News Volume 2 Issue 37
July 15th 2011
What's new this week?
- Repository Updates
- ROCing the Cloud
- Announce: Cloud Ready - NetKernel Enterprise Edition 4.1.1 AWS EC2 AMI
Catch up on last week's news here
Repository Updates
The following updates are available in the NKEE repository...
- nkee-arp 1.5.1
- Fixed a possible NPE
ROCing the Cloud
Maybe its because I've been tied up in contract negotiations all week. Maybe its because I'm a nerd. Maybe I'm just dissatisfied with the software industry's mystical faith-based approach to ascribing value.
Whatever the reason, I decided I really wanted to have a true engineering model of a hard core cloud-based architecture. And, of course, since this is what I implicitly espouse every week, to understand the affect of using NK/ROC versus a classical software solution.
Measure Twice to Model Once
First we need to measure some real systems (once a physicist always a physicist)...
You might have seen this graph (below) before, its the results of running the nkperf scaling benchmark on my Toshiba Intel dual-core hyperthreaded laptop. The test software stack is NKEE 4.1.1, on Sun Java 6, on Ubuntu 10.04 LTS 64-bit.
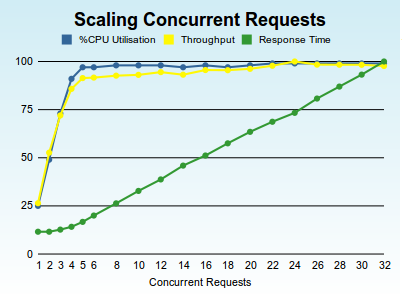
Important points to note are that NetKernel scales throughput linearly with CPU cores when the concurrency of requests is <= the available cores. Once we occupy all the cores, there's no more overhead to process with (more threads can't do any more work if there's no more CPU cores to run them on), so the throughput flat-lines and the response time linearly increases with concurrency.
Its important to note that NetKernel itself (and the Java/OS software stack) continues to remain linear and displays no "drooping tail" in the throughput - the system is maxed-out but NetKernel maintains the throughput at the constant peak.
(Incidentally its interesting to note that my system has 4 logical cores but this consists of two "real cores" and two hyperthreaded logical cores. Notice that the response time shows this and starts to increase from a flat response curve when concurrency reaches three to four. This shows hyperthreading is good, but its not quite a true core)
Cloud Server
So lets try the same experiment on exactly the same software stack, but this time lets use a fairly high-end virtualized cloud platform with 8-logical CPU cores on a well-known public cloud platform. The graph belows shows nkperf running on the same NKEE 4.1.1, Sun Java 6, Ubuntu 10.04 LTS 64-bit but on a virtualized hosted server. (For reason's of respect for confidentially we'll not reveal the platform).
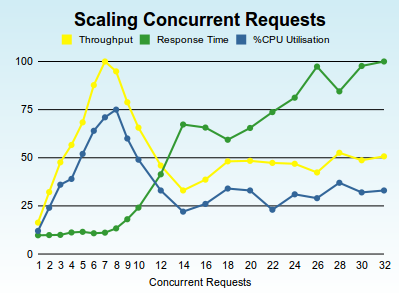
We see that, as before, NetKernel scales linearly when requests <= available cores. But notice that once we max out the available cores, we see a dramatic non-linear response as the concurrency exceeds the capacity. We know from our first results on a physical server (and repeated on many many customer server stacks) that this is not due to the NK/Java/OS software stack.
We can only speculate that this is either the underlying virtualization technology, or the platform's own extrinsic scheduler throttling. Given that throughput eventually settles at a suspiciously tidy 50% of maximum, my inclination is to think this is deliberate load management by the cloud provider for this class of instance.
Linux KVM Virtualization
We can estimate if this is a correct assumption by changing the virtualization technology. Here's the results when we run exactly the same software stack but this time on my laptop but on a KVM virtualized Ubuntu 64-bit with 4-logical virtual cores. (This is exactly the same laptop as for the first graph of physical cores and no-virtualization)...
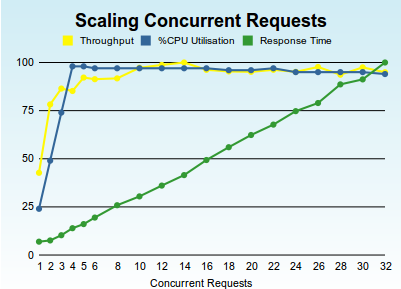
Its very interesting that this virtualized instance shows qualitatively the same results as the physical results showed before. But we note that there are some tangible differences due to virtualization: we can see that the Intel virtualisation instructions are not supported on logical hyperthreaded cores, since we see our linear scaling stop at a concurrency of two. However we still see a solid non-drooping maxed-out throughput response curve - indicating that the intrinsic scheduling of a virtualized CPU is linear on the Linux Kernel's KVM virtualisation technology ("big up" to the Linux possy).
Whatever the underlying cause of the vendors cloud non-linearity, we can definitively state one firm conclusion: Not all clouds are created equal; some are more equal than others.
Clouded in Thought
OK we have some data, where does this put our modeling? Well the first thing we can say is that if you are running a free-running software stack with a thread-per-request (a la PHP, Tomcat and all the other standard J2EE application servers) then you are by definition operating at the far end (right-hand side) of the concurrency/throughput curve. This holds no matter what the underlying software architectures - if you have more threads than CPUs then you're not getting more work, you're just dividing CPU capacity more. This is the engineering equivalent of throwing spaghetti at the wall and hoping that it'll stick.
It follows that if you are running a regular software stack on the cloud platform shown in the second graph, you are operating at precisely 50% of the possible maximum performance of that instance. Or put it another way - in a large scale cloud architecture you're paying twice as much for cloud server instances than you should be.
There's another consequence of thread-per-request spaghetti slinging. Every thread will require that a substantial amount of transient memory will be allocated for its operational state (objects are created and the memory is occupied even if the threads are not being scheduled). So admitting every request to a system on its own thread means your host memory allocation has to be large, a lot larger than is actually necessary for the work being done. As with cores and performance this is another lever that cloud platforms use to weight the pricing model - cloud memory costs rise non-linearly.
Software Load Lines
If you have a platform who's response curve is non-linear and which displays a clear peak in throughput it would be a very good idea to constrain your system to sit on that point. This is not a new concept in engineering, in fact in electrical engineering its called the Maximum Power Transfer theorum. A varient in electronics is the design of the biasing of transistor circuits by consideration of the Load Line.
What's needed in software systems, especially cloud-based systems, is a maximum throughput load line.
In the case of the cloud system we measured, you want your system to sit on the red-line...
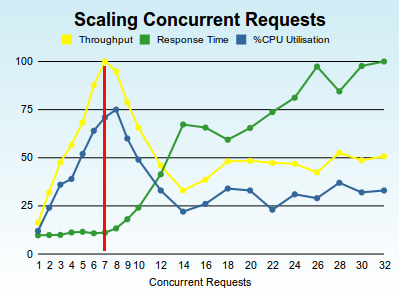
One interesting observation, notice that peak throughput occurs at seven concurrent requests. Its interesting that we've consistently seen that these peaks occur at one less than the nunber of cores. It seems like you need to allow one core for the use of the virtualized operating system - not really a surprise but worth remembering.
OK. So how do we do this. Well with NetKernel its trivial. You just wrap your application in a throttle...
<prototype>Throttle</prototype>
<config>
<concurrency>7</concurrency>
<queue>1000</queue>
</config>
<space name="Wrapped Application Space">
<!--Your app imported here--></space>
</overlay>
Those half-dozen lines of "code" will lock your application load line on the peak throughput. Or to put it another way, that small change will double your system throughput under load. Or put another way you can manage the same load on a NetKernel server as on two-load-balanced cloud servers with conventional software.
One more thing to consider. If you're only admitting seven concurrent requests into your application, and in this example you're holding up to 1000 in queue, then your transient memory requirement through operational object state is 7/1000ths of an unmanaged system. Or put it another way, you definitely won't be visiting the premium-priced high-memory-end of the cloud provider's platform smorgasbord.
OK, so we've identified one dimension in which NetKernel and ROC can kick-ass in the cloud. Lets look at another...
Systemic Caching
There's a simple statement that you've probably heard me say many times before. NetKernel caches everything. But what I've neglected to do is explain what that actually means in terms of performance and system costs.
Firstly, lets just explain why NetKernel's cache is unique. After all, the world is currently awash with vendors offering magic-bullet caches for your standard applications.
In a classical software system, you introduce a cache by binding it (either explicitly or implicitly with a point-cut) at a tier in your architecture. You write your application to manage that reusable object state at that single cross-cutting boundary in your architecture.
This is a one-dimensional cache architecture. No matter what your system is doing, there is a single dimension at which you have decided you will pro-actively manage computational state.
NetKernel is different. NetKernel caches everything in every tier. It has a multi-dimensional systemic cache. It allows the actual value (the amount of use (hits) vs the true computational cost of the state) to determine what state is worth holding on to. Not where it comes from in the system architecture! If something is computationally expensive and is being used frequently you'd like to eliminate the cost of recomputing it - no matter which tier of your architecture it is in.
This is what NetKernel does.
I won't go into the additional features that NK offers with its systemic dependency hierarchy to atomically and automatically manage cache consistency. Instead, we want to understand what the effect of caching has to our system's throughput and how its affects our cloud platform engineering model.
Realworld Hit Rates
The fundamental reason that caching works is because the real world obeys natural statistical distributions. Or in cloud software system terms: the same stuff gets requested more than once.
The degree to which stuff is re-requested depends on the application. But for typical modern web applications and services its common to have power-law distributions. In more classical problems its likely these will flatten to normal-distributions. But generally caching stuff pays off because the physical world is consistent and behaves predictably.
OK, so we need a concrete measurement again so that we can consider this in our model.
Shown below is a snapshot, taken earlier today, of the memory and cache charts from one of our standard NKEE servers. Its actually this wiki's host NK instance (where you're reading this news letter). This NK instance is also running the 1060 research corporate web applications, the NetKernel portal with the NKEE support and other portlets, the bugxter software management system, the NKSE download services, and a sundry collection of various REST web-services.
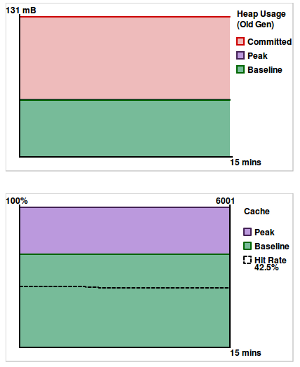
As of time of the snapshot, this NK instance had been up for 1 week 6 days 23 hours. The last time it was rebooted was due to the system-core update we shipped two weeks ago. FYI we always deploy and test any updates on our real production machines before we release them to you guys.
OK, what is it telling us. Well it showing that our memory footprint is within sensible engineering limits - this JVM has a heap of 196MB and you can see that the actual Old Gen is 131MB of which our footprint is occupying no more than about a third. Or put another way, our memory allocation is three times our minimal needs.
This system is throttled and so, as I explained above, our peak transient memory use is always bounded and within engineering margins of control. It doesn't really need me to say it, but this is proving what I implied earlier, NetKernel is incredibly light on memory use. Which in our model means you won't need to pay for expensive cloud memory.
OK, look at the second chart showing a snapshot of the cache state. This system has a cache size of 6000 (peak). We see that we are typically churning 30% (baseline) - ie this is stuff that has been determined to be insufficiently valuable. (As a short aside, this is another reason why NetKernel out-performs ordinary application servers. We are holding all transient state and determining if its useful retrospectively. It follows that we dereference and release garbage in a predictable way and which is very sympathetic to the underlying JVM garbage collection. From an operational state management point of view NetKernel is the JVMs perfect OO application.)
Hit me baby one more time
OK so lets cut to the important part. Notice the dotted line and the number 42.5% in the chart legend. This is the cache hit rate and is the instantaneous percentage of requests which are being satisfied from cache.
As I said above, applications vary and indeed application loads vary with time of day/week, but the real world can't be fooled, it'll keep showing up with statistical distributions. I can say that across all our production systems we typically see production cache hit rates of between 40% and 50%.
On some servers, like for example the documentation server, we could provide a large cache and get a 100% hit rate. But we tend not to do this, since the engineering trade-off is: why waste the memory (pay for memory) when the main "users" of this site are the almost constant web-crawlers. Our doc server runs on a 96MB JVM and last time I looked its cache hit rate was running at 30% - which ain't bad when you think that web-crawlers have very poor statistical distributions.
Hit Rate Significance
So we have a measurement, and a sense of what a production system hit rate might be. But what does it actually mean?
The diagram below lets us think about the effect of hit rate. Lets imagine we have 100 requests in our system and the instantaneous cache hit rate is 40%. It follows that of those 100 requests, 40 will be satisfied from cache. It further follows that in the time saved not computing those 40 requests, we can compute 40 more requests. But of those 40 requests 40% of those will be cache hits saving us 16 requests. We can do 16 more requests, but 6.4 of those will be cache hits etc etc...
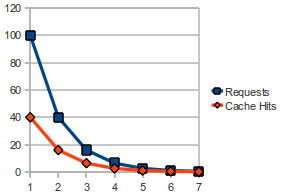
The diagram above shows the requests and corresponding cache hits for a 40% cache hit rate.
Expressing a cache hit rate as a percentage is not immediately intuitive to our human brains. But what it is really, is the common ratio of a geometric progression. To determine how many extra requests we can process because of the savings of the cache hits we need to sum the geometric progression.
If you remember your undergraduate maths classes you'll recall that the sum of a diminishing geometric progression is
S=1/1-x (x<1)
where x is the common ratio. (In the case of 40% hit rate, x is 0.4)
OK so now we know what cache hit rate actually means. Here's a table of hit rate versus relative efficiency. Where no cache (0% hit rate) is 100% relative efficiency - ie we have to compute all the requests which is the same as a system with no caching at all.
| Cache Hit Rate | Relative Efficiency |
| 0% | 100% |
| 10% | 111% |
| 20% | 125% |
| 30% | 143% |
| 40% | 167% |
| 50% | 200% |
| 60% | 250% |
| 70% | 333% |
| 80% | 500% |
| 90% | 1000% |
Again, our brains aren't good at intuiting these things, but we can see that hit rate actually corresponds to an exponential relative performance gain.
Getting concrete, our own typical systems have operational hit-rates of 40-50%, what this actually means is that they are 166%-200% more efficient than an ordinary system.
But there's another fact that we ought to also take in. NetKernel is caching in multiple dimensions, this is not just about single architectural boundary layer. It is also weighting the cache to hold the most valuable state in the entire system. It follows that a cache hit is disproportionately effective in NK (compared with a typical single-dimensional caching boundary). Because ROC systems are dynamic equilibrium, we can't really say how much additional efficiency this translates to. But what we can say is that this projected relative efficiency is the worst case benefit. A real NK system is doing better, a lot better, than this.
But we need a model, so we'll take this base worst case improvement as our "cache-benefit factor".
Cost Model
OK we have two sets of measurements and some understanding of the factors at play. We can now build a model of what this translates to in terms of TCO of operation of a cloud server instance.
Lets combine the two effects. Lets assume we go to the "extreme effort" of adding the six lines of code to introduce a throttle. That alone gives us 2x throughput gain on the vendors cloud platform. Now lets consider our typical operational cache hit rate, lets take the lower number of 40% hit rate, which corresponds to a 1.66x throughput gain.
Combining the two gives us the NetKernel Factor = Throttle Gain x Cache Gain. In this case that's 3.33. Or put another way, a NetKernel instance with a 40% hit rate on a cloud server will have a minimum performance equivalent to 3.33 free-running classical software stacks on the same platform.
Now let's see if we can translate that to something we can understand financially. For obvious reasons we can't reproduce other people's published pricing for their cloud instances. But lets say a standard cloud instance costs something like 25c per hour, a higher-end model with more memory costs something like 75c per hour. Lets also include the NetKernel Enterprise license cost - which when broken down from an annual rate, is about 30c per hour. How much would using NetKernel save just on cloud operational costs.
I have a spreadsheet with the hardcore calculations which I'm very happy to give to you - just drop me a note. But here's a useful ready-reckoner...
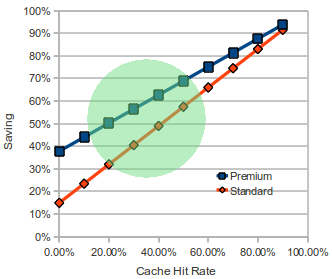
The green region signifies the "zone of probable operation". ie a likely typical systemic cache hit rate for everyday applications.
So what does this actually mean for our concrete example. Lets say I have a 40% cache hit rate and my system is a hard core highly utilized server on the cloud platform. You will save, just on operational cloud fees, $6,402 per annum for standard instances, and $23,515 on the 75c per hour premium instances. (This is after you've factored in the very reasonable pricing for NetKernel).
But even if you're sceptical on the effects of the systemic ROC multi-dimensional caching (which I deal with below). Look at the 0% hit rate on the cache. Just by shaping the load line with NetKernel's separation of architecture from code, you are still making significant cost savings.
Finally, there are hidden cost savings which are not included in this model. The model doesn't include the reduction in operational memory requirements (a non-linear cloud weighting factor), nor does it include the actual instance storage costs. Many cloud platforms actually back-load their cost model so that storage is not part of the hourly operational rate - if you use NetKenel you have fewer instances and so smaller ongoing storage costs. Finally, cloud providers also charge for network transfer costs. NetKernel not only caches as much of your application as it can, it also automatically deals with 304 Not-Modified responses - so most web applications, even if they are dynamic, will operate with automatic minimisation of network transfer costs.
Computer Science
Its easy to be cynical and look at the numbers I've quoted above with a degree of scepticism or downright mistrust. However I hope that by now you've realised that I'm at heart a scientist - it goes against everything I believe in to not try to present an objective and impartial perspective on things.
So having constructed the model above I got to thinking if maybe there was something hard core that I could present to give you something irrefutable and reproducible for you to judge my assertions by. Then I remembered this article on the Ackermann function.
For those without the computer science background - the Ackermann function is a pathologically extraordinarily expensive computation which is not just exponential in time, but tetrential. To see how bad it is - the value A(3,12) can't be computed using a local intrinsic recursive Java function, as the JVM runs out of stack.
If you read my previous article, you'll see that it explicitly shows how NetKernel is able to discover by extrinsic resource oriented recursion repeated state actually inside the Ackermann algorithm's resource set. For example, take a look at the visualizer trace of the A(3,6) to see how NK keeps biting lumps out of the recursion cost by rediscovering existing systemically memoized (cached) state.
This got me thinking. What is the cache hit rate of the Ackermann function when computed on NetKernel? So I loaded up the demo and tried computing various A(m,n) values, each time clearing the cache and then after each run looking at the cache hit rate (as reported in the representation cache viewer).
Here are the results for the A(3,n) series...
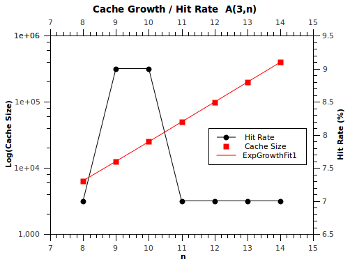
What we find is that, as we'd expect, the cache size grows exponentially, however rather amazingly, the hit rate remains roughly constant at 7%. That is, NetKernel is discovering that 7% of all computations in the classical Ackermann function are not necessary as they're points that were already known. Now this is even more amazing when you realize that each point hit saves exponential time cost!
Effectively, NetKernel is biting exponentially large chunks out of the computational state space. For free, automatically!
So now you might say, well if its doing this surely it must have a measurable effect on the computation performance - yeah that's exactly what I thought too. So here's the execution time (plotted on a log scale to show the linear exponential gradient).
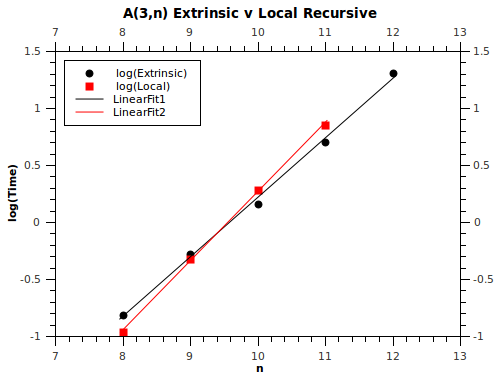
So the amazing thing here is that NetKernel computes the Ackermann function faster than a local recursive Java implementation for A(3, n>9). But recall that its logarithmic space shown on the graph. The difference in the gradients of the two lines shows that in the time-domain, NetKernel is exponentially faster than the local recursive Java function! Our only problem is that Ackermann is still going exponentially faster than NetKernel - so we can never catch it up. (In other words NP is not P).
And my point here is this. Nobody would suspect that a pure recursive function would contain hidden statistical distributions of reusable state. You'd never even try to memoize the Ackermann function - in fact it would be very hard to do it since we've had to use a recursive identifier notation just to write down the name of the Ackermann values (eg A(2,A(3,2)) see for example the visualizer traces).
So my impartial objective statement of fact is this. When I say NetKernel discovers the multi-dimensional statistical distribution of reusable state within an entire application (not a one-dimensional layer), then I am in fact telling the absolute and provable truth.
It follows that it is also true when I say. NetKernel is damned efficient. Really really efficient. And that means my assertions about TCO hold water. Or, to put it another way, even after you've paid for NetKernel licensing, if you compare the costs of using NetKernel with a so-called "free software" solution - then the free solution is more expensive.
Final Word
Of course the frustrating part of this entire article is that its carefully focused on just the tangible operational costs of software choice.
But the reason we embarked on the research behind ROC back in the late 90's was that it was the economics of the development and long term evolvability of classical software that made no sense.
NetKernel brings the Web-inside not for some fancy technological or computer science reasons. But because the Web has amazing economic properties that ought to be applied to software engineering at whatever scale.
In the Web the cost of change is less than the value added. How do I know? Because the Web has grown exponentially since its birth.
So even though there are operational, performance and just plain good and sensible engineering reasons to use NetKernel. The one that I can't show you easily is the most important one of all. With NetKernel it takes fewer developers, to build larger scale systems, that are more robust and more malleable with respect to change.
Announce: Cloud Ready - NetKernel Enterprise Edition 4.1.1 AWS EC2 AMI
We have set up a pre-configured NetKernel Enterprise Edition for immediate launch on the Amazon AWS EC2 cloud platform. The system is installed on an Ubuntu 10.04 LTS 64-bit operating system with a Sun Java 6 JVM. To instantly boot a NetKernel instance search in the AMI list for:
ami-eb04c082 1060 NetKernel EE 4.1.1 Ubuntu 10.04 LTS 64bit v1.0
As you might expect from my "prevarication" above, it runs comfortably on the smallest t1.micro instance offered by AWS.
Once you have booted an instance you'll need to tunnel port 1060 over ssh. You can do this on your local machine like this...
ssh -L 1060:localhost:1060 -i your-ec2-key ubuntu@your-dynamic-ec2-hostname
At which point you can just point your browser at
To manage the cloud NetKernel instance via its backend admin fulcrum.
We've provided a special AWS AMI control panel explaining the details of the install, and what you can do to customize it for production. On the running instance this can be viewed here...
http://localhost:1060/panel/urn:com:1060research:aws:ami:readme:panel
Please let us know how you get on and if there are any features you'd like to see.
Belgium Bootcamp
Keep you diaries open for October in Brussels. This will definitely happen. We need to fix a date and sort out logistics but be ready for a ROC Fall (Autumn geddit?) in Brussels.
Have a great weekend,
Comments
Please feel free to comment on the NetKernel Forum
Follow on Twitter:
@pjr1060 for day-to-day NK/ROC updates
@netkernel for announcements
@tab1060 for the hard-core stuff
To subscribe for news and alerts
Join the NetKernel Portal to get news, announcements and extra features.
NetKernel will ROC your world
 |