|

NetKernel News Volume 4 Issue 6
February 15th 2013
Repository Updates
The following updates are available in the NKEE and NKSE repositories...
- layer0-1.96.1
- Made "captured traces" map thread-safe (fixes possible NPE when used by the Visualizer).
- nkse-dev-tools-1.50.1
- Updated with enhancement needed by cache heatmap
- system-core-0.36.1
- Added support for discovery of fulcrums for cache heatmap.
The following update is available in the NKEE repository...
- nkee-dev-tools-0.28.1
- Cache Heatmap Visualiser - Space Explorer extension (see below).
NEW: Cache Heatmap
The new second generation cache, which we released a few weeks ago, includes the cache visualizer tools. One of the tools under the "Cache Layers" tab, lets you discover which endpoints at which location in your architecture are serving the key cacheable representations.
This tool is very powerful and allows the list to be filtered and the selections viewed by various weighting criteria (see image below).
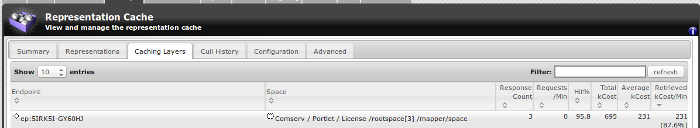
However, useful as this is, it is a something of a power-tool aimed at cache analysis by engineering architects.
Now, given all of the runtime state of NetKernel is a set of resources (everything is). And the Cache Layers tool is just a representation of the cache layers resource. What might you get if you had a different representation of the same resource?
Say, a representation that maps the cache state resource onto the space explorer structure diagram?
Step forward, the Cache Heatmap Explorer (click to reveal)...

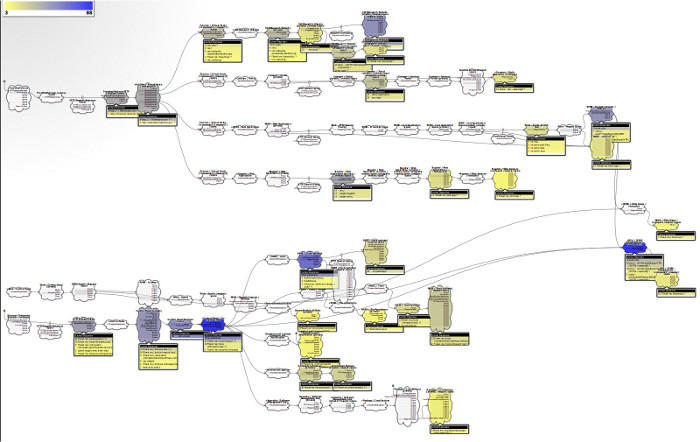
This diagram* shows the caching heatmap for a production NetKernel instance. To keep things manageable its been captured to show just a small part of the total production architecture. The default colour map uses yellow to show some caching and ranges to dark blue indicating lots of caching. White spaces are showing no cached representations.
You can see here that this production system has nearly a dozen regions of strong caching. (We'll discuss the interpretation and implications of these heatmaps below.)
Here's another** view using a "spectrum" colour map and with the module boundaries also shown...
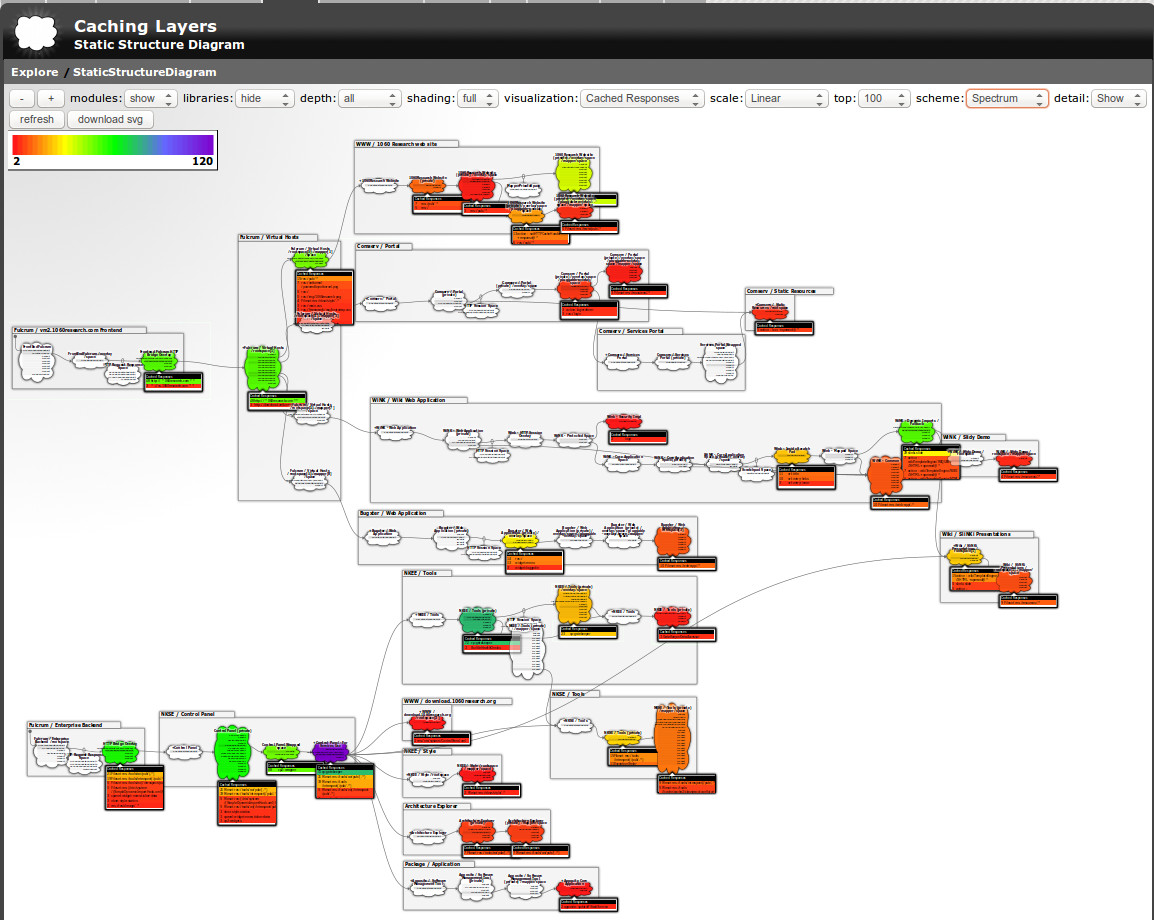
* If you're thinking "what diagram?" then you didn't click the reveal link
** If you're thinking "Another?" maybe you still haven't clicked the reveal link or worse something went wrong with our javascript trickery, so here's static links to the diagrams [1], [2]
Availability
The Cache Heatmap tool is provided as part of the NKEE dev tools. To start using it, just go to apposite, synchronize with the repos and apply all updates. After update you'll find it in the Explorer tab here.
Usage
The Cache Heatmap tool defaults to showing the top 100 endpoints with a linear weighting. This is generally pretty fast to generate and will have no impact on a production server, but if you're prepared to wait a little, you can get highly detailed views by selecting "top 1000" ("all" shows every single endpoint - so take care with this one).
Just play around with the settings to find the view that suits you best.
Bear in mind that this is showing a live realtime view of the caching distribution in your system. So use the tool's refresh button to see the current state of the distribution.
Browser Support
The heatmap representation is pure SVG. We find that browser support for SVG tends to vary, but that Firefox's rendering leads the way and does a great job. However if your browser is not so good - then just use the "download" button and view/print the SVG from your prefered vector graphics tool.
Cache Heatmap Discussion
The Cache Heatmap view is new but what its showing is old. NetKernel's systemic adaptive multi-dimensional cache model first appeared seven years ago with the transition from NetKernel 3's special case to the generalised ROC model in NetKernel 4+. But being a new view of something that has been there all along is still important.
The significance is that a living diagram radically transforms our ability to comprehend what is going on. And, it provides a very clear new way to understand some of the ideas we've discussed countless times in this newsletter.
Below is the diagram of a production server we showed above. Lets think about what its telling us. Click the image to highlight some of the significant regions...
Server-side
The first region of note is highlighted in green (over on the left hand side). These are the architectural channels to which fulcrums+ are connected to applications. You can see that many applications naturally merge into these channels (click the image again to toggle the highlighting off if you want to see the detailed architectural structure).
In this case these "green channels" are the architectural mechanics for the HTTP stack (the HTTP bridge overlay, Session overlay, RESTOverlay, Virtual host mapper etc).
Our applications want to participate in the HTTP stack and so we have them exposed to HTTP requests by using a dynamic import - which is why you see the convergence of the application channels in the diagram. (From left to right this looks like a fanout - but really conceptually this is right-to-left and an "architectural fan-in").
Clearly every HTTP request that comes into the HTTP stack is different. The corresponding ROC requests are resolved down through the HTTP stack until they get routed to the appropriate application. So the HTTP stack state has to be transient. But the application state is often reusable for more than one request. Sometimes every request gets the same representation.
So we should naturally expect that reusable state will percolate up to the top of the application. What we're seeing is that we're actually doing a little better than the natural expectation. A cache hotspot is appearing in the architectural space which merges the applications. One level closer to the front than just inside the application channel.
We're also seeing that some resource state is even being reused even higher up the HTTP channel. This is showing the cache hits of the dynamic configuration of the stack itself. ROC architecture uses ROC self-consistently.
So our diagram is providing an interesting perspective, but its hardly too much of a surprise. If this were a classical n-tier architecture then we might well wave our finger in the air and bind a caching layer into our code just beneath the top layer.
But the point here is: we didn't have to guess and we didn't have to bind anything to anything.
The system discovered this for us.
Client-side
Now lets look at the red zone (over on the right hand side). In a classical n-tier perspective you might think of this as the bottom tier. Architecturally, this is the outbound facing side of our system - the parts that are acting as clients to the outside world. Things like HTTP requests, database queries etc etc. So its the client-side of our symmetric client-server solution.
We might not have guessed it, but we see there are some cache hotspots. So there are significant numbers of resources being reused down here.
Now cleary, any request that gets to this point has been through the entire stack above - it was something that hadn't been seen before and so went past the green hot-spots. Now think about this. Even though this had to have been unique or unseen before, there are resources that it shares in common with other requests - and so we save the effort of going out to fetch them.
We see that the system is eliminating redundant requests to the DB and/or REST services.
Now, you might have considered it might be worth putting another caching layer into your classical architecture down here at the bottom - but it might have been regarded as a second-order optimisation.
The point here is: we didn't have to guess and we didn't have to bind anything to anything and its clearly not a second order effect.
The system discovered this for us.
Micro-Caching Middleware
So now lets look at the cyan zone (in the middle). This is what, in the classical n-tier perspective, we'd think of as the "middleware". The application specific business logic that actually differentiates one application from another.
If you're a request that gets into this region then, by induction, we know you must be doing something unique - since you missed the green zone. It follows that if we're doing something unique then there's no point even thinking about caching here.
Bzzzzzt. That would be wrong then.
The diagram is showing that even though we are deep inside these application-specific architectures and even though we must be doing unique things here, we're finding that there are hotspots. Which means we're eliminating redundancy here too.
We can think of this effect as "micro-caching". That is, even within the transient lifetime of a given request, we can often find reuseable state that eliminates unnecessary computation.
The Systemic Realization
Now toggle the image again to hide the highlighting. There's something more important to discuss.
Its easy to get excited about the hotspots and to ascribe architectural significance to them - that's the n-tier conditioning we've all had. Take another look at the diagram. Can you see the big picture?
It doesn't really matter where you look. There are as many coloured spaces as not coloured spaces.
The heatmap is telling us that there is reusable resource state throughout the system.
Why does caching work?
Lets step back from the details of this tool for a moment. Lets ask the bigger question. "What is caching and why does it work?".
Caching is the normalisation of state such that identical requests for the same information can be served with a single copy of the state.
Why does it work, because physical reality is such that it repeatedly makes identical requests for information.
That is, the real world is not random. The real world has patterns and those patterns repeat. The repeating of the patterns leads to a statistical distribution of state.
In physical system's we're used to seeing Gaussian (Normal) distributions. This is a mathematical way of saying - things repeat and they repeat within smooth and average ranges.
In network systems (and software applications) the distributions are often even more sharply defined. Today, for example, everyone is googling Oscar Pistorius.
Caching works because our information systems are connected to the real world. And the real world obeys statistical laws.
Why NetKernel's Cache Isn't A Cache
OK, so now that we've got a tool that shows us the cache heatmap. Its time to tell you what the NetKernel Cache really is.
For it is not a cache by this definition:
"Caching is the normalisation of state such that identical requests for the same information can be served with a single copy of the state."
The reason for this is that every cache technology you've ever come across implicitly assumes that the following words are present in the definition:
"Caching is the normalisation of state such that identical requests for the same information in the same context can be served with a single copy of the state."
That is: caches assume a common context.
In a Web browser or server they assume a uniform global address space. In a CDN they assume a global address space differentiated by country geolocation. In computer science, memoisation of functions only works when referential integrity is preserved.
NetKernel's Cache will normalise state even when the requests do not share an identical context.
NetKernel discovers and manages computational state in such a way that contextual equivalence is discovered.
In memoisation terms - NetKernel kicks out local referential integrity of a function and introduces systemic contextual integrity of the computational state space.
Or put less academically. Caching works because the realworld obeys statistical laws. NetKernel works because it maintains a set of state of a portion of the reusable reality. NetKernel determines when requests from widely different contexts can use the same representation state.
In ROC abstraction terms. Resources are abstract. Representations are concrete. Representations are a realization of the abstract resources. NetKernel's "cache" is a systemic realization of the state which the realworld wants.
The realworld does not have one uniform context. The real world is contextually relative. NetKernel has no problem with relativistic context.
This is why NetKernel is unique. This is why when you look at the heatmap diagram you see a distribution of reusable state that you could never have predicted. Its the exact distribution which is currently the most valuable to the realworld.
But the realworld is constantly changing. So is this heatmap distribution. NetKernel tracks reality.

For my own benefit, I think of the heatmap as a view of the multi-dimensional computational energy surface. Everywhere you see some colour you are seeing a local minima and we have reduced the net computational energy cost of the system.
In quantum mechanics when many quantum states share the same eigenvalues - we call it a degenerate system. You can think of ROC as enabling Degenerate Computation.
Economic and Computation Efficiency
At this point, with the new tool and a new way to gain a perspective of the ROC world, it might be useful to look at these old discussions.
- The Economic Value of Systemic Caching
- The Effect of Systemic Realization (Systemic Memoisation) on HardCore Computer Science Algorithms
One final thought. The new cache supports huge heap sizes. Imagine what happens when you cast your big-data sifting algorithms in the ROC domain...
Cache Engineering Analysis
Making good approximations for reality is part of the art of tuning a caching architecture. While NetKernel will do a good first order approximation automatically - often you'll want to apply some strategic perspective and add your own engineering boundary conditions. This is not necessarily trivial and is an art that comes from experience.
We can help you. Ask us about the professional services we offer as the experts in ROC.
Have a great weekend.
Comments
Please feel free to comment on the NetKernel Forum
Follow on Twitter:
@pjr1060 for day-to-day NK/ROC updates
@netkernel for announcements
@tab1060 for the hard-core stuff
To subscribe for news and alerts
Join the NetKernel Portal to get news, announcements and extra features.
NetKernel will ROC your world
 |